1. Introduction
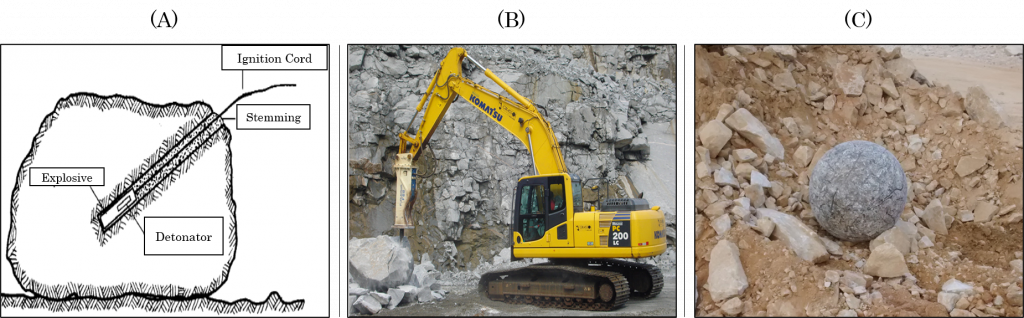
Bhandari (Bhandari, 1997) defines that the main objective of fragmentation is to obtain the largest volume of rock possible at minimum cost, guaranteeing the quantity and quality of the material, so that the profits from the operations subsequent to this process are maximized. In blasts, this fragmentation process occurs when an explosive is inserted into a hole and detonated, thus creating a state of tension followed by a violent gas expansion that can reach the order of 10 GPa, which causes the rock to be fragmented and displaced.
A badly sized blasting can cause the generation of fine materials and/or the generation of boulders, which may require costly tackling operations, such as the use of explosives, hydraulic breakers or drop ball, significantly increasing the overall cost of the blast operation. In accordance with Bernardo (Bernardo, 2004), this second stage is only necessary when the block dimension is larger than the load equipment bucket or the crusher feeder.
Dinis da Gama (Dinis da Gama, 1971) clarifies that optimal blast can be achieved if it results in adequate fragmentation, in order to achieve the lowest overall cost by combining the phases of drilling, blasting, loading, transport and mineral processing. Certain authors explain that the blast stage is one of the most important in the entire production chain, because even though the fragmentation curve obtained after this process will be altered by comminution in the processing facility, the granulometry after the blasting process, it will have direct implications for the cost of productivity and efficiency of the processes subsequent to this step. Cunningham (Cunningham, 2005) also points out that if this fragmentation is not foreseen and controlled, it could make a mining project unfeasible.
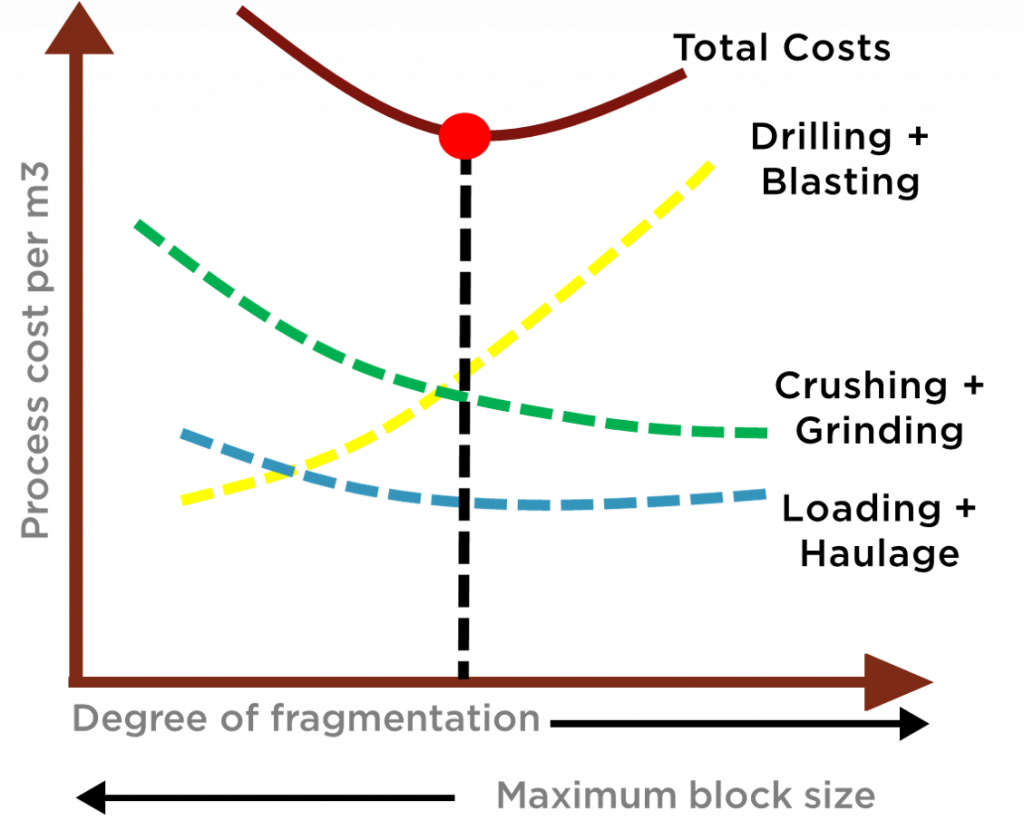
As it is possible to observe in figure 2, the degree of fragmentation generated by the rock blasting is inversely proportional to the maximum dimension of the generated blocks. Therefore, the greater the degree of fragmentation, the higher the cost per cubic meter of the blasted rock volume. It is therefore notable that if the degree of fragmentation is low, this cost will also increase due to the average size of the material having a larger dimension, thus increasing costs in the processes of loading, transport and mineral processing. Other considerations can be made to obtain a greater degree of fragmentation, as referred by Hustrulid (Hustrulid, 1999):
- Increasing the amount of explosive: This option, analyzing the evolution of consumption figure 2, will increase costs, since it is only possible to obtain this explosive increase, increasing the drilling diameter to higher values, or changing the blast design to high specific drilling (m/m3).
- Use of explosives with more energy: Maintaining the cost of drilling, increasing only the cost of explosives, due to being more energetic and theoretically more expensive.
Given a large number of variables present in the blast, there will be an optimal degree of fragmentation which, if achieved, will then reduce the production of boulders and reduce fines, making the blasting process costs as small as possible (guaranteed quality and volume) and can then minimize subsequent steps. Cunningham (Cunningham ,2005) explains that to achieve this goal it is necessary to use empirical models that will predict the desired granulometry according to the geometric parameters, mechanical properties of the rock and also taking into account the characteristics of the explosive to be used. One of the most used models in the extractive industry is the Kuz-Ram model, due to its simplicity and versatility in its application.
I want to make it very clear that there are much more robust models used for the prediction of fragmentation of rock dismantling, and each one with its particularities, namely: Crush Zone Model CZM, Kuznetsov-Cunningham-Ouchterlony KCO, Multiple Blasthole Fragmentation MBF, Kuz-Ram 2005 and xP- frag. For this first approach, I will present the Kuz-Ram model presented to the world in 1983.
Here I will put a video about the different models for rock fragmentation from blast:
2. Kuz-Ram model
Humans have always tried to understand the future. The same is true of the mining engineer, who is making efforts to try to predict the result of the fragmentation generated by the blasting
(Miranda, Leite, & Frank, 2017).
An example of this is given to us by Cunningham (Cunningham C., 1983) who presented in 1983, in Luleå (Sweden), from his studies elaborated in South Africa, one of the most used models worldwide regarding the forecast rock fragmentation with the use of explosives. In this empirical model, the mechanical properties of rock, explosives and geometric variables (burden, spacing, subdrilling and stemming), are taken into account from the combination of three sets of equations, which are the Kuznetsov, Rosin-Romler equations and the uniformity index.
2.1 Kuznetsov equation
Kuznetsov (Kuznetsov, 1973) started his studies on fragmentation and published his results in 1973. His work states that the average fragmentation size, which he calls Xm or X50, has a direct correlation with the powder factor, mass of TNT contained per hole and with the rock factor. His equation was limited only to the use of TNT, however Cunningham managed to incorporate explosives other than this one in the expression. The expression developed was:
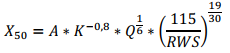
- X50: Sieve opening where 50% of the fragmented material is passed (cm);
- K: Powder factor (kg/m³);
- A: Dimensional index that can be obtained in the classification of rock masses proposed by Lilly, 1992. This factor corresponds to the degree of difficulty of fragmentation of the rock mass, with intervals between 0.8 and 22.
- Q: Mass corresponding to the quantity of explosive per borehole (kg);
- RWS: Mass relative energy of the explosive compared to pure ANFO.
2.2 Rosin-Rammler equation
Cunningham realized through his studies in South Africa that the granulometry of the material fragmented by explosives could be described by the Rosin-Rammler granulometric function. And that the midpoint of this curve could be determined by the equation proposed by Kuznetsov (Kuznetsov, 1973). However, to correctly define this function, it was necessary to determine (or know) the parameter form “n”. The RR function is described by the equation:
Being:
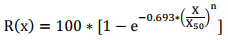
- R (x): Represents the percentage of passing material in a sieve of size “X” (%).
- X: Mesh size corresponds to a sieve (mm).
- X50: Sieve opening where 50% of the fragmented material is passed (mm);
- n: Uniformity index or shape parameter that defines the particle size distribution. According to Jimeno, Jimeno and Bermudez (Jimeno, Jimeno, & Bermudez, 2017), this figure is between 0.7 and 2.2.
2.3 Uniformity index equation
The uniformity index equation had to be elaborated by Cunningham (Cunningham C., 1983) to meet the passing material in each mesh of the sieve that is determined by the Rosin-Ramler equation. This was possible after listing all the geometric parameters of blast design. Jimeno, Llera, Urbina and Jimeno (Jimeno, Llera, Urbina, & Jimeno, 2003) assume that this value can vary from 0.8 to 2.2, in which the higher this value, the more uniform the fragmented material will be. And when low, it would indicate significant amounts in terms of the generation of fine and coarse.
The expression is:
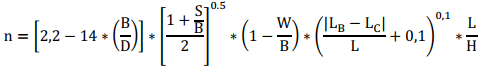
Being:
- n: Uniformity index that defines the particle size distribution.
- B: Burden (m);
- S: Spacing (m);
- D: Drilling diameter (mm);
- W: Standard deviation of drilling accuracy (m);
- L: Charge length (m);
- LB: Bottom charge length (m);
- LC: Column charge length (m);
- H: Bench height (m).
3. Conclusions
Next week I will bring you a little bit about the crushing model. And we will see step by step of its mathematical construction.
For more technical information, you can find this site, in the topic “Technical Corner”.
http://downloads.o-pitblast.com/
Stay well guys 😀