The exploration of earth has significantly advanced in the second half of the past millennium, leading to the discovery of new areas and an increase in the import and export of material goods. However, this rapid expansion has strained the natural flow that used to protect the environment. The ratio of exploited and cultivated areas to explored areas has become insufficient for effective environmental recovery.Conventional mining methods involve a series of unit operations, including drilling, blasting, loading, transportation, crushing, grinding, and flotation. The goal is to maintain a productive pace while prioritizing safety and sustainability throughout the process. Digitization is a major driving force for change in the mining sector, and digital optimization tools can dramatically increase the productivity and sustainability of drilling and blasting operations. For example, reducing the number of non-detonating holes can lead to economic savings and increased sustainability (Hustrulid, 1999)
The Three Scopes
According to current leading greenhouse gas corporate standard (World Resources Institute), a company’s emissions are classified into three scopes (Figure 1).
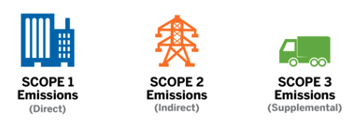
Scope 1 emissions are direct emissions from the resources owned and controlled by a company.
Scope 2 emissions are indirect emissions from the consumption of purchased electricity, steam, heating and cooling.
Scope 3 emissions are all indirect emissions, not included in scope 2, that occur in the value chain of the reporting company.
Case Study
It has been selected as case study, two blasts from Drill & Blast Operations at mine operating in Northern Finland.
For both blasts the explosive utilised was Kemiitti 810 (K810OP), a bulk emulsion explosive used for surface excavations. Kemiitti 910 consists of two semi-finished components, matrix, and gassing agent. Both components are produced at Forcit Factory in Kemi, Finland. The semi-finished components (matrix and gassing agent) are transported to site where the finished bulk emulsion explosive is manufactures and charged into boreholes by use of mobile surface charging units. The environmental product declaration of this product provides emission factors for the CO2 and CO emissions while the NOx emission factor was obtained from literature (Ibukun. et. all, 2017).
The blast design plan for both blasts was done on a blasting design software, O-Pitblast (Figure 2 and 3).
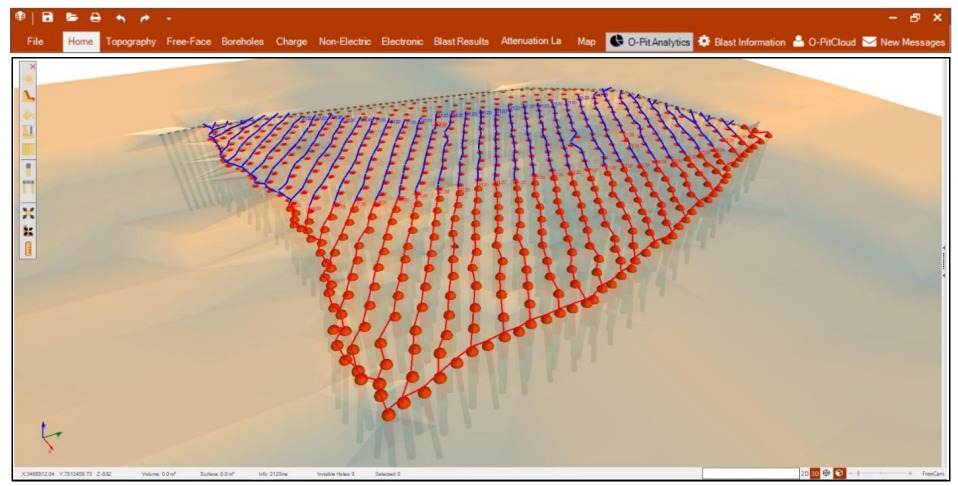
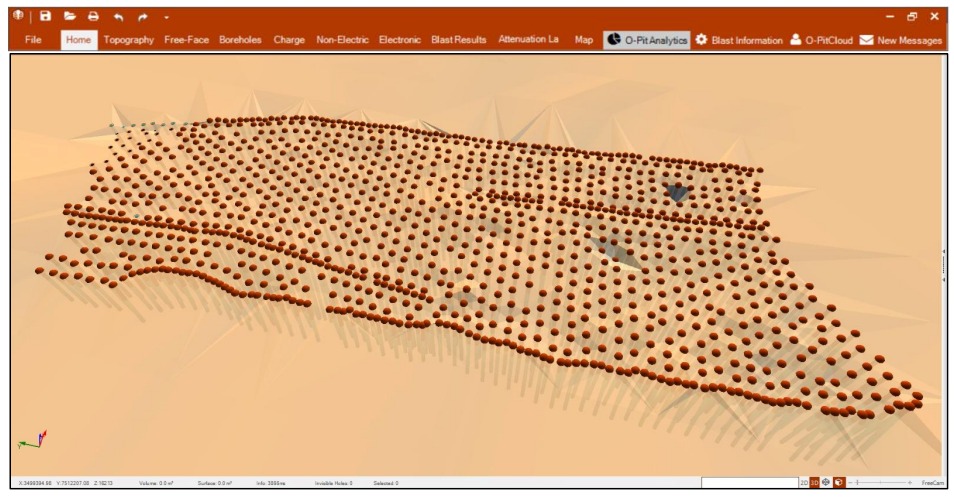
O-PitSurface is a good tool for this purpose as it features a simulation tool that was used to manage, measure, design and evaluate all blast cycle.
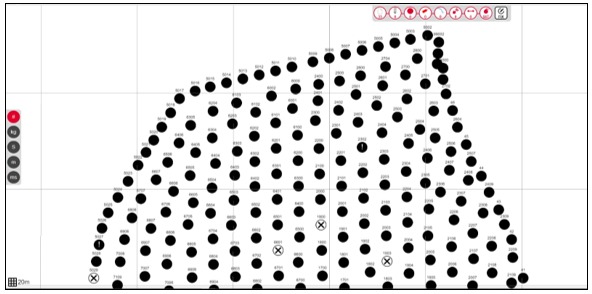
From there an automatic data collecting system that tracks real data from the field was used to gather real data from the blasts, O-PitOperations (Figure 1). The data was than exported on a csv file for further analysis.
The data collected from both O-Pitblast, including planned number of boreholes (Nº), planned charge of explosive (Pexp), planned drill depth (PL), bench height (H), burden (B), spacing (S), stemming (St) and volume of blast (V), and O-PitOperations, including the real number of boreholes (Nº*), real charge of explosive (Cexp) and real drill depth (ML), is displayed on Tables 1-2:
Table 1 – Blast 1 Resume – O-Pitblast® / O-Pitoperations©
| Nº | 708 holes |
| Pexp | 239870,80 kg |
| PL | 10695,11 m |
| D | 229 mm |
| H | 13,58 m |
| B | 3,00 m |
| S | 3,00 m |
| St | 4,40 m |
| V | 86698 m3 |
| Nº* | 567 holes |
| Cexp | 197487,44 kg |
| ML | 7414,75 m |
Table 2 – Blast 2 Resume – O-Pitblast® / O-Pitoperations©
| Nº | 1164 holes |
| Pexp | 212166,80 kg |
| PL | 15245,35 m |
| D | 165 mm |
| H | 11,07 m |
| B | 3,00 m |
| S | 3,00 m |
| St | 3,54 m |
| V | 116256 m3 |
| Nº* | 1129 holes |
| Cexp | 205250,12 kg |
| ML | 14629,81 m |
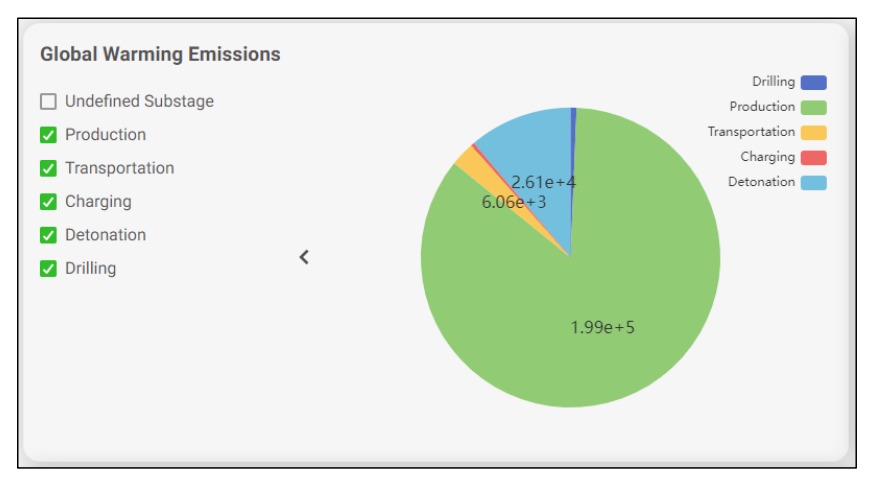
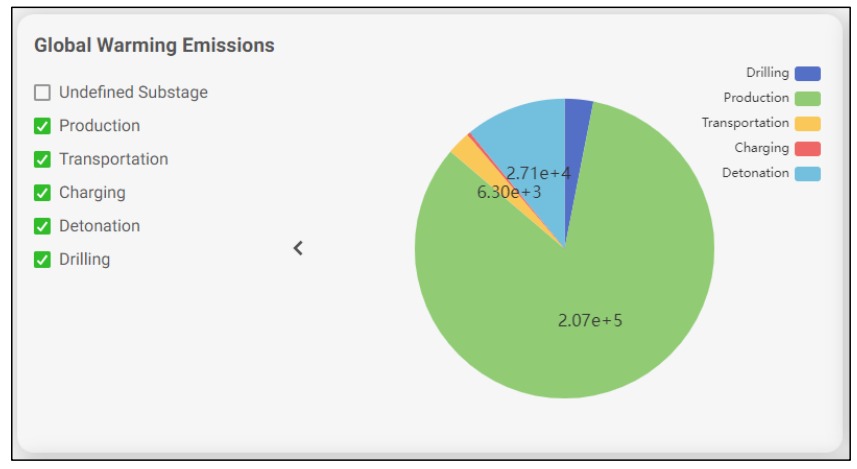
After the merge of the information was done, the results for CO2 eq emissions are displayed in Figures (5-6).
For the First Blast the CO2 eq emissions were of 199000 kg for production, 6060 kg for transportation, 851 kg for charging, 26100 kg for detonation and 1500 kg for drilling. CO and NOx emissions were of 4340 kg and 987 kg for detonation. Total drilling & blasting emissions were of 349375 kg of CO2 eq, 4344 kg of CO and 987 kg of NOx.
For the Second Blast the CO2 eq emissions were of 207000 kg for production, 6300 kg for transportation, 885 kg for charging, 27100 kg for detonation and 7700 kg for drilling. CO and NOx emissions were of 4520 kg and 1030 kg for detonation and were of 0,513 kg and 0,128 kg for drilling. Total drilling & blasting emissions were of 1119370 kg of CO2 eq, 4530 kg of CO and 1084 kg of NOx.
To compare emissions between multiple blasts, a good indicator that can be used is emission per m3 of rock blasted. For the First Blast the results obtained were 4,02 kg CO2 eq per m3, 0,050 kg CO per m3 and 0,011 kg NOx per m3. For the Second Blast the results obtained were 9,63 kg CO2 eq per m3, 0,039 kg CO per m3 and 0,0093 kg NOx per m3.
Conclusion
The aim of this study was to propose a method for calculating, tracking, and reporting CO2, CO, and NOx emissions from drilling and blasting operations in the mining industry, using advanced digital tools. The results demonstrated the efficacy of these tools in promoting sustainability in these operations. Analysis of the results showed that scope 3 emissions, which include those occurring in the company’s value chain, were significantly higher than the other scopes. This was largely due to the high CO2 eq emissions generated during the production of explosive components, such as ammonium nitrate.
Emission factors for detonation and fuel consumption were obtained from environmental product declarations and databases. It was found that more accurate emission factors can be obtained by considering non-ideal behavior during both detonation and fuel combustion, using thermochemical codes. This approach is recommended for future studies.
In this study, environmental product declarations for drill rigs were not available, so values for the production, transportation, maintenance, and disposal of these equipment were not included. It would be very important in the future to have such data from drill rigs to be even more precise with emission calculations. However, it was concluded that scope 3 emissions would increase if these values were considered.
From a perspective of environmental impact management, it is recommended that future studies include a wider range of environmental impact categories, such as acidification of land and water, eutrophication, and abiotic depletion of resources.The “Mine-To-Mill” theory suggests that all mining operations should be viewed as a dynamic system. While this study focused on the initial operations of the extractive process, it is recommended that future studies integrate emissions from all operations and analyze these operations from an optimization and dynamic system perspective. Smooth integration between platforms is also an essential part of the future emission calculations.
O-PitEco proved to be a valuable tool for this study due to its advanced computational capabilities, which were utilized to accurately estimate the emission factors associated with drill and blast operations.